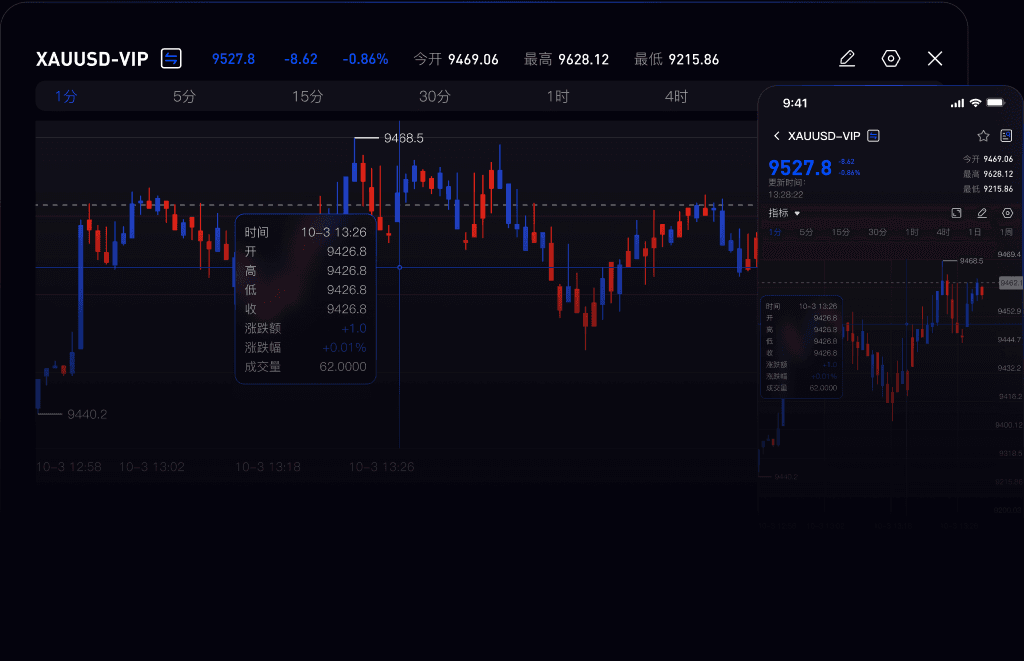
The U.S. Dollar Index continued its upward trend on Wednesday, rising to 102.90; it had previously increased by 0.5% on the prior trading day, reaching its highest level since April 2025. Inflation data exceeded expectations, coupled with increasingly hawkish comments from central bank officials, leading investors to expect that the Federal Reserve will raise interest rates more aggressively in the coming months, pushing the dollar higher. Further reinforcing the hawkish tone, Federal Reserve Governor Christopher Waller warned that a 50 basis point rate hike in December could be reasonable; Dallas Fed President Lorie Logan supported at least two more rate hikes of 25 basis points each. Currently, the market believes there is about an 86% probability that the Fed will raise rates by 25 basis points at the December meeting; investors are also beginning to factor in further rate hikes in January and possibly April. Meanwhile, oil prices have rebounded, recovering some of the losses incurred over the previous two days. The dollar strengthened against all major currencies, with the largest gains against the Swiss franc and the euro. In the short term, the dollar's performance will largely depend on whether next week's inflation data will again provide the Fed with reasons to reinforce its view that higher rates may be necessary. If new upward surprises occur, it will strengthen the rationale for further tightening of policy and may help the dollar continue its rebound, especially in a context where risk appetite remains weak. However, if the data is soft, it could challenge the recent gains, particularly as U.S. Treasury yields offer little support and speculative positions show signs of fatigue. Currently, the dollar seems to have stabilized, but whether it can continue to rebound from this base is another matter. Therefore, the upward targets to consider are the 103.00 integer level and the 103.50 area; on the downside, focus on the 102.50 level (October 28 high) and above the 102.00 integer level. Today, consider shorting the dollar at 103.00, stop loss: 103.10; target: 102.50; 102.40 On Wednesday, oil prices stabilized above $85 per barrel, but due to signs of easing tensions between the U.S. and Iran, they remained near eleven-week lows. President Donald Trump hinted that additional military strikes against Iran may no longer be necessary, boosting optimism for a diplomatic resolution. Meanwhile, Congressional Democrats are considering using the upcoming government funding deadline to push the Trump administration to end the conflict. Although ships in the Strait of Hormuz are still being attacked, oil transport in the Middle East has largely returned to pre-war levels. However, uncertainty remains: Iran demands that the U.S. ease sanctions and lift the maritime blockade before it is willing to participate in negotiations. As hopes for de-escalation increase and regional oil exports continue to recover, the U.S. crude benchmark price has fallen nearly twenty percent from its late October peak, with most recent gains being retraced. From a technical perspective, the daily MACD for WTI is still in a downward structure, and after creating a new low in the adjustment, the bullish rebound has been weak, leaving the possibility for further declines. Resistance is near $88 on the daily chart; if this level is not reclaimed, the bearish structure remains unchanged; on the downside, $84 is a key low, and if broken, it will open up further downside potential. Based on previous material readings, the current price of 86.20 is still close to the 100-day simple moving average of 86.67, and the gain or loss at this position can serve as a reference for short-term strength or weakness. On the 4-hour chart, the MACD has shown divergence, and the rebound correction after a short-term oversold condition has not yet shown reversal signals, indicating that the current recovery is more likely a technical repair within a downward trend rather than a trend reversal. Daily resistance is at the 100-day simple moving average of 86.67 and around $87.50, while support is also at $84. Then there is the psychological support level near $80.00. Today consider going long on crude oil at 85.20, stop loss: 85.05; target: 87.00; 88.00 Gold is currently accelerating its intraday correction, challenging the key level of 4,000 USD per ounce on Wednesday. This precious metal continues its downward trend against the backdrop of a strong dollar, rising U.S. Treasury yields, and increasing market bets on further rate hikes by the Federal Reserve. On Tuesday, the global gold market faced significant selling pressure,plummeting nearly 3% in a single day, breaking below the critical psychological support near 4100, with an intraday low of 4013.53/ounce, marking a new low for nearly a week, as market sentiment quickly shifted from relatively optimistic to cautious. The immediate trigger was the U.S. October Consumer Price Index data coming in higher than expected, coupled withseveral officials signaling a possible acceleration in the pace of rate hikes, drivingto strengthen, and U.S. Treasury yields to rise sharply. For gold, the 4000 USD level has shifted from a 'round number' to a psychological battleground for bulls and bears in the short term. Overall, the core drivers of this sharp drop in gold prices are the unexpectedly sticky U.S. core inflation and the hawkish statements from Federal Reserve officials, which directly raised interest rate expectations and the dollar, weakening the appeal of holding gold. On the daily level, spot gold is slightly bearish in the short term, with the gold price running below the 20-day simple moving average of about $4,056, but still within the Bollinger Bands. The lower Bollinger Band (around $3,898) temporarily provides a buffer for the gold price; however, the gold price has failed to regain the Bollinger middle line at $4,056, limiting the rebound space. Market momentum is stabilizing: the Relative Strength Index (RSI) is slightly below 47, the bullish-bearish watershed, and the MACD indicator remains positive; however, the Average Directional Index (ADX) reading is only 24, indicating that the current trend strength is weak. Resistance above: the first resistance level is at the 20-day simple moving average of about $4,056, followed by the integer level of $4,100; stronger resistance levels are at $4,148 (the early week high) and the $4,200 area, which will limit significant upward movement in the gold price. Support below: the first psychological support level is the Bollinger lower band at $3,876; and the low for the year at $3,870. If it breaks further down, the next target is the integer level of $3,800. Today, consider going long on gold at 3,980, stop loss: 3,975, target: 4,020; 4,030. On Wednesday, USD/JPY continued its bullish momentum, rising 0.54%, trading around 159.65 at the time of writing, reaching a ten-week high. Supported by the renewed strength of the dollar, as investors increasingly expect the Federal Reserve to raise interest rates further, the currency pair decisively broke through the resistance level of 159.00. The dollar's rebound stems from hawkish comments by Fed Governor Christopher Waller and stronger-than-expected U.S. Consumer Price Index data released on Tuesday. Waller warned that if monthly core inflation remains "around 0.3% or higher," then "the Fed may need to raise rates by half a percentage point in December." The subsequent CPI report showed that core inflation rose 0.3% in October, higher than the expected 0.2%, while overall inflation rose 0.4%, also above the expected 0.3%. More importantly, the probability of another 25 basis point rate hike in January has surged to 60%, up from just 19% before Tuesday's repricing, further enhancing the dollar's appeal. From a technical perspective, the daily level of USD/JPY is slightly bearish recently, with the exchange rate running below the 100-day simple moving average of 159.00, while closely hugging the 20-day simple moving average above 158. The 14-day Relative Strength Index (RSI) is around 55, indicating neutral momentum, suggesting that recent downward pressure is consolidating rather than accelerating. On the resistance side, the initial resistance level is at the 160 integer level, with the September 2 high of 160.40 forming tight pressure above, which needs to be reclaimed to alleviate the current corrective tone. On the support side, the initial support level is at 159.00, and a deeper position at 159.01 (100-day simple moving average) is around 158.86 for the 20-day simple moving average; if the daily closes below this lower boundary, it will open up space for a deeper pullback within a larger range. Today, consider going short on the dollar at 160.00, stop loss: 160.20, target: 159.30; 159.20. EUR/USD fell sharply at the end of the North American session on Wednesday. In fact, the strong performance of the dollar weighed on the currency pair, causing it to fall below the 1.1100 contest range for the first time since April 2025, as the market's bets on further tightening by the Fed continued to strengthen the dollar's sentiment. The market is now turning its attention to the weekly initial jobless claims data to be released on Thursday, as well as comments from Fed and ECB officials; at the same time, falling oil prices and hopes for an agreement between the U.S. and Iran are weighing on support, leading to continued pressure on the dollar, as the currency "continues to weaken due to the significant drop in oil prices, which helps alleviate market concerns about inflationary risks. Overall, the latest developments have clearly boosted investor optimism about the prospects for reaching an agreement to end the U.S.-Iran conflict, and it is believed that the impact of energy prices will be short-lived, which will help weaken the rationale for a stronger dollar. Meanwhile, in the Eurozone, lower oil prices provide support for the Eurozone, as the European continent is a net energy importer. From a technical perspective, the EUR/USD has broken below a key support level, but it still needs to close below 1.1100 on a daily basis to pave the way for further declines. The Relative Strength Index (RSI) is bearish and operating in the oversold territory, indicating that sellers are in control. If the EUR/USD remains below 1.1100, it may test the swing low of 1.1050 from May 23, 2025. The next target is the psychological level of 1.1000, followed by the intraday low of 1.0951 from May 12, 2025. On the upside, the first resistance level is at 1.1100. If this level is broken, the next target is the daily high of 1.1170, followed by 1.1200. The key resistance level above is at 1.1273 from November 4, followed by 1.1300. Today, consider going long on the euro at 1.1080, stop loss: 1.1070, target: 1.1140; 1.1150.
View Details